

I compared census data from the area to demographic data of the schools. The results were interesting and while they reinforce much of what was covered in the news, the pattern that stuck out to me was how large a relationship there is between the growth of charter schools and changing enrollment in public schools. The following maps are samples from the full project. QGIS was my mapping tool, and the NYC Department of Education and American Fact Finder were the main sources for data.
I live in a school district in Brooklyn that was often in the news last year because of gentrification in the area and segregation in its schools. In order to look more closely at the situation and see if I could better understand some of the forces behind the issues I looked at all the data I could find from public and charter schools in District 13 over the 14 years since the first charter school opened in Brooklyn.

This map was built with census data from 2000 decennial census and American Community Survey data from 2013. I intersected the building footprints in Brooklyn with the census tract shahpes so that the choropleth map would show population densities where there are buildings and residences.
I felt the census tracts over simplified the distribution of demographics visually and using the building foot prints gave the maps the texture that alludes to the complex density of our population.

The building foot prints outlined in black are school locations. This map compares the demographic diversity of the area with the population of the schools.
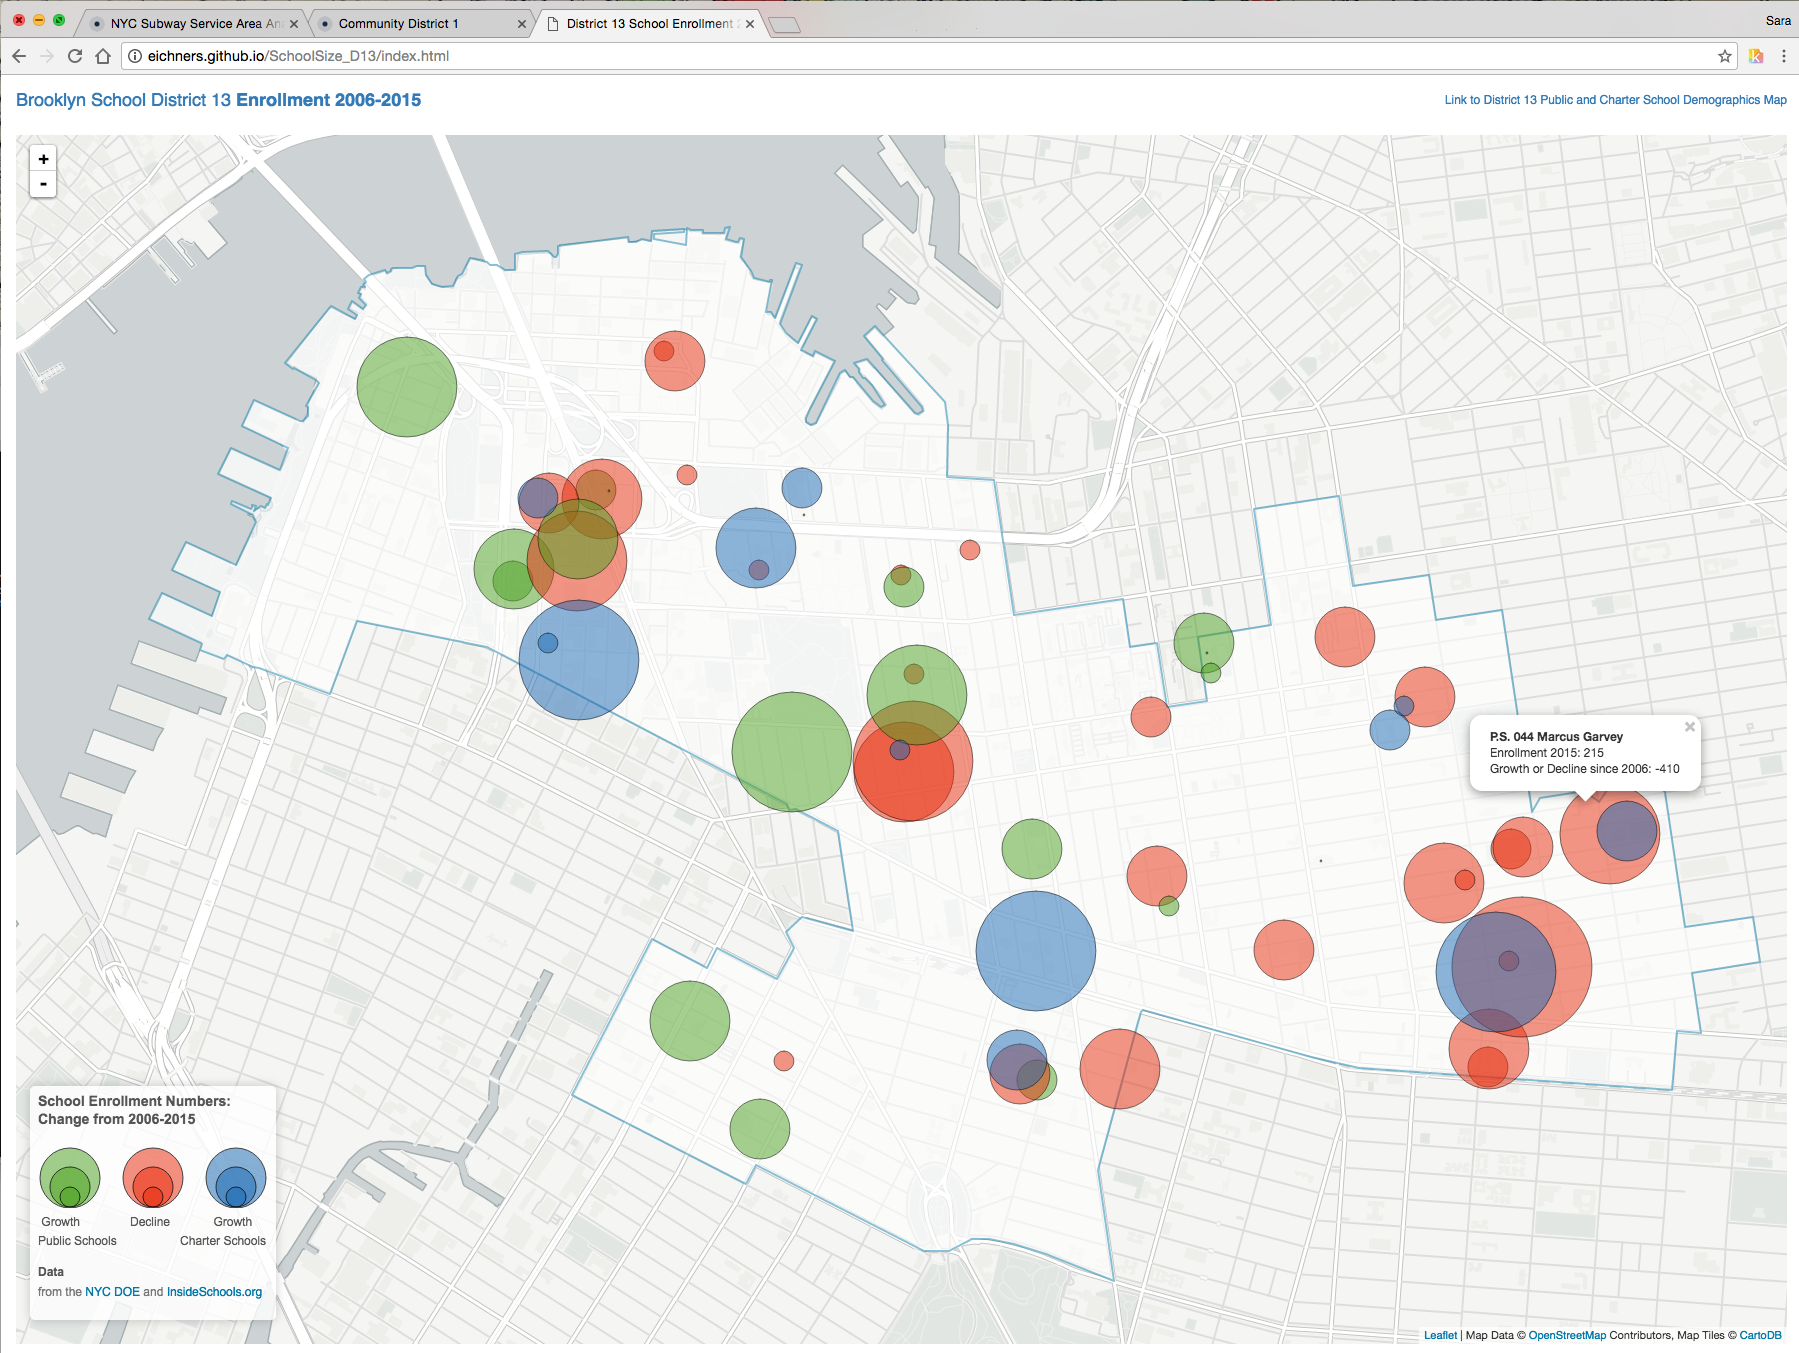
This is from an interactive component of the project. Each circle shows decline or growth of student population. Charter schools only show growth. Many of the public schools' enrollments have declined significantly. The interactive version was built with Javascript and Leaflet. The data was processed in QGIS.